.png)
How to Create Lake Maps with the Sonar Data Analysis Software
- Wesley Gerrin
- Feb 2, 2024
- 3 min read

Updated: Jul 20
WHAT YOU'LL LEARN
This tutorial explains how to use the sonar data analysis software to transform user-generated sonar files into bathymetric maps, aquatic vegetation maps, bottom-characterization datasets, and downloadable reports. You will learn how to upload files, define study boundaries, select appropriate analysis settings, generate maps, and export resulting GIS data.

BEFORE YOU START
You will need a stable internet connection to complete the mapping process.
Download and gather all the sonar files associated with the project.
If you have a shapefile border, make sure you have a zip folder containing each of the following: .shp, .shx, .dbf, & .prj.
Make sure you have measured the depth of your sonar transducer below the surface of the water.
Determine the map resolution you will be using.
IMPORTANT: This application does not permanently store uploaded data or completed reports. Download and save all desired files before closing your session.
SONAR DATA ANALYSIS SOFTWARE SETUP
Step 1: Upload your sonar file to the application.
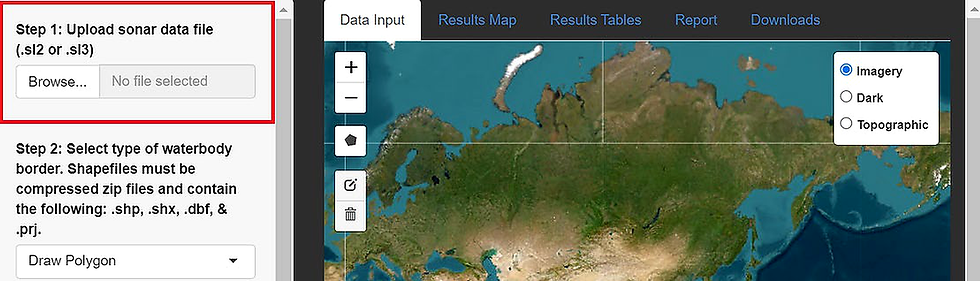
Step 2: Select the type of border you will be using. Options are drawing your own polygon or uploading an ESRI shapefile. ESRI shapefiles must be in a compressed (zip) folder containing .shp, .shx, .dbf, & .prj.

Step 3: When the data have finished uploading, a point will show up on the map. Clicking this point will zoom to the location of the sonar data points.

Step 4: Depending on your selection in Step 2, either click the polygon drawing tool and click points around the edge of the waterbody to trace the edge or upload your ESRI shapefile.
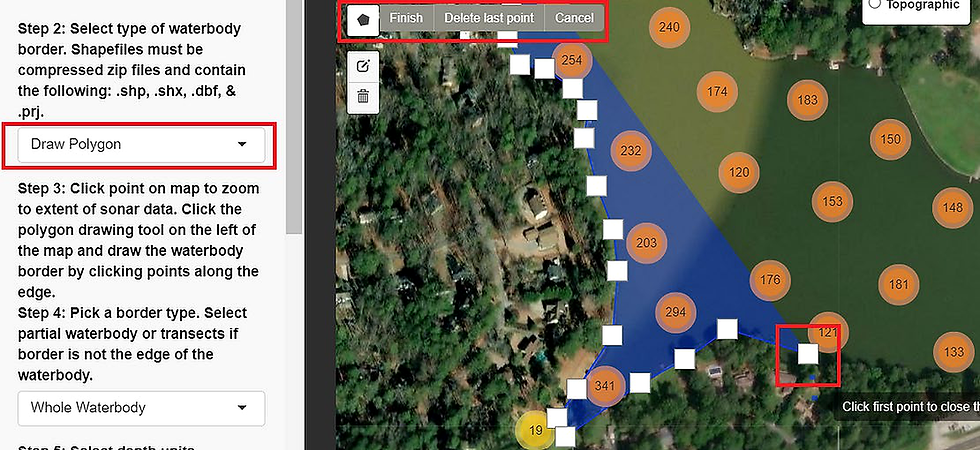
NOTE: To maximize accuracy, be careful not to exceed the boundary of the sonar dataset by too great a distance.

Step 5: Select the type of study area. Select this parameter carefully, as the modeling approach that estimates depth changes based on the selection.

NOTE: Only select whole waterbody if data exist close to waterbody edges.
Step 6: Select the depth units desired for maps, analysis outputs, and reports.

Step 7: Input an offset value for the sonar data. This value should be the depth of the sonar transducer below the water. This will ensure that water above the transducer is included in the analysis.

NOTE: This measurement must be in the same units as selected above and must be a positive number.
Step 8: Enter a lake, project, or client name, a data collection date, and a name of the data collector. The information entered here will appear in reports downloaded from the application.
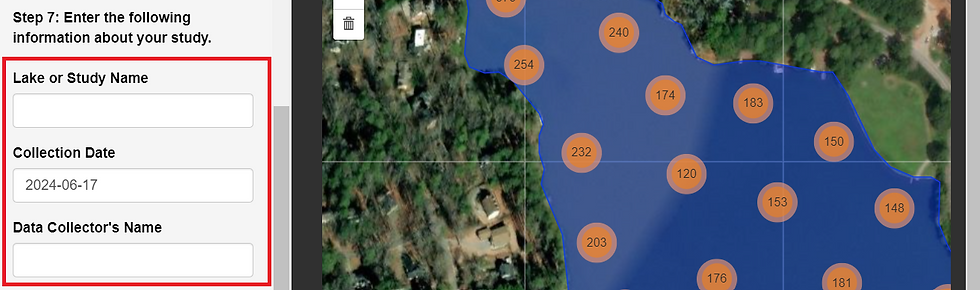
Once all parameters have been entered, click the "Generate Maps" button to analyze the data and create maps!
VIEWING RESULTS
Within the results map tab, users may change background base maps, toggle between data layers, measure distances or areas, and download a PNG image of the map view.

Another feature of the results map is the area of interest polygon tool. This tool allows users to draw multiple area of interest polygons and calculate surface area and volume statistics. These calculations are shown in a table below the map and in the interactive report.
USING THE AREA OF INTEREST TOOL

Step 1: Use the polygon tool and click points around areas of interest to draw polygons.

Step 2: Once a polygon is finished drawing, the table below the map will populate with statistics for the area of interest.

RESULTS TABLES
The results tables provide summary statistics related to the bathymetry and vegetation density data.


The report tab compiles all analyzed datasets, maps, and tables into an interactive report containing information pertinent to each analysis. Users can download this report from the downloads tab.

DOWNLOADING DATA
IMPORTANT: This application does not permanently store uploaded data or completed reports. Download and save all desired files before closing your
The following reports and data are available for download:
Raw depth data and vegetation estimates (.csv)
Interpolated depth and vegetation estimates (.csv)
Interactive report (.html)
Printer friendly report (.pdf)
Interpolated bathymetry, vegetation, and bottom rasters (.tif)

Comments